
Net (ex VAT): £0.00
Gross (inc VAT): £0.00
VAT (at 20%): £0.00
Popular Worldwide VAT Rates
How Many UK Companies Are There?
There are 5,498,990 businesses in the UK.
This total includes limited companies, partnerships, and sole traders.
Below is a simple breakdown by business type.
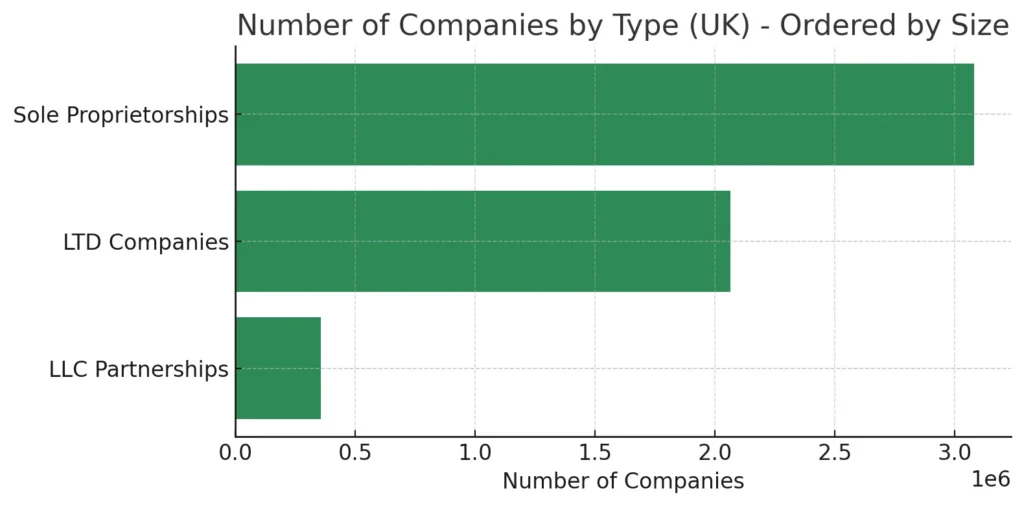
Number of Companies by Type
Sole traders make up the largest group.
There are 3,079,795 sole proprietorships.
Partnerships and LLC-style businesses follow next.
These total 355,760 businesses.
Limited companies make up a large share.
There are 2,063,435 LTD companies registered in the UK.
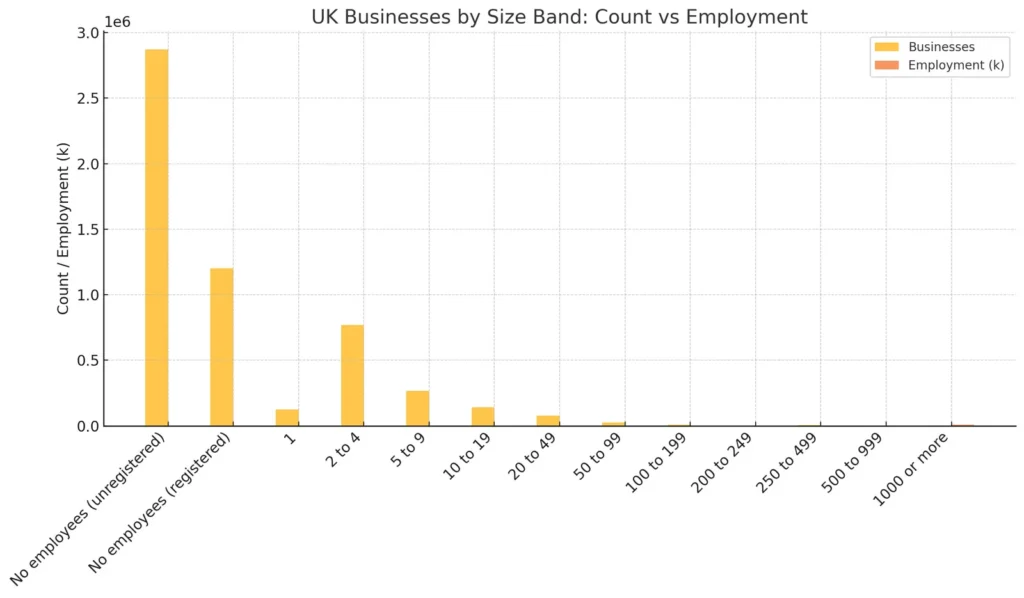
Number of companies by employee count
| Employee Size Band | Number of Businesses | Employment (thousands) | Turnover (£ millions) |
| No employees (unregistered) | 2870855 | 3154 | 124024 |
| No employees (registered) | 1200970 | 1285 | 241988 |
| 1 | 124220 | 275 | 27995 |
| 2 to 4 | 770185 | 2132 | 347064 |
| 5 to 9 | 266860 | 1798 | 304088 |
| 10 to 19 | 141900 | 1944 | 289327 |
| 20 to 49 | 78000 | 2373 | 491236 |
| 50 to 99 | 25410 | 1764 | 429630 |
| 100 to 199 | 10160 | 1427 | 331642 |
| 200 to 249 | 2180 | 486 | 165159 |
| 250 to 499 | 4205 | 1457 | 360135 |
| 500 to 999 | 2115 | 1459 | 467182 |
| 1000 or more | 1930 | 8199 | 1693136 |
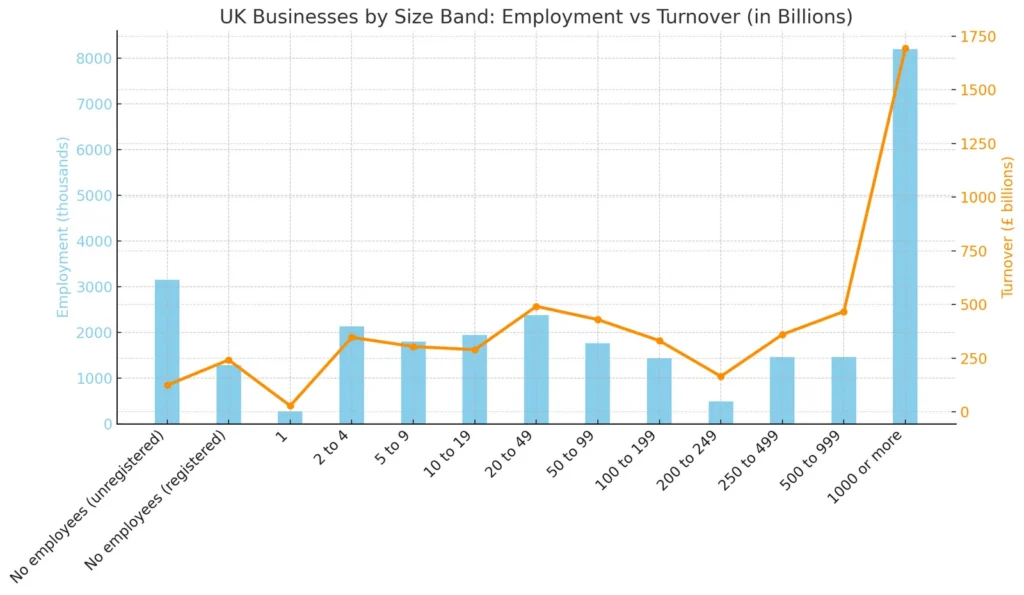
This chart shows total employment and total turnover for UK businesses, grouped by employee size.
For example, the 200–249 employee band includes around 2,180 businesses.
Together, they employ about 486,000 people and generate a combined turnover of £165 billion.
That’s an average of ~£75.8 million turnover per business, showing how larger companies contribute significantly to the UK economy—despite being fewer in number.
Any company with a turnover in excess of £90,000 per year must register for VAT, you can use our free VAT calculator to work out your pricing.
Distribution by industry
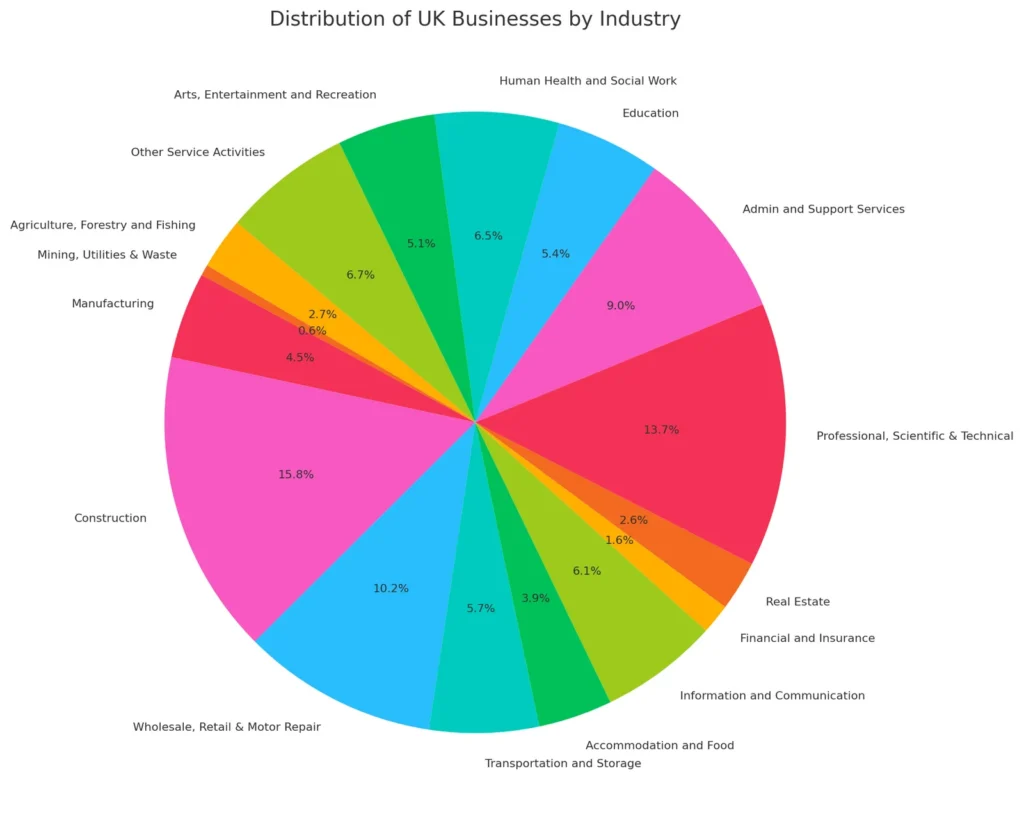
| Industry | Businesses | Employment (thousands) | Turnover (£ millions) | Turnover (£ billions) |
| All industries | 5498990 | 27754 | 5272607.0 | 5272.607 |
| Agriculture, Forestry and Fishing | 147845 | 499 | 57859.0 | 57.859 |
| Mining, Utilities & Waste | 31050 | 380 | 298841.0 | 298.841 |
| Manufacturing | 246805 | 2552 | 683969.0 | 683.969 |
| Construction | 870185 | 2066 | 406931.0 | 406.931 |
| Wholesale, Retail & Motor Repair | 558935 | 4889 | 1810784.0 | 1810.784 |
| Transportation and Storage | 312775 | 1587 | 239512.0 | 239.512 |
| Accommodation and Food | 212035 | 2537 | 130362.0 | 130.362 |
| Information and Communication | 337945 | 1539 | 403779.0 | 403.779 |
| Financial and Insurance | 86140 | 1108 | ||
| Real Estate | 142865 | 567 | 80574.0 | 80.574 |
| Professional, Scientific & Technical | 754940 | 2928 | 525029.0 | 525.029 |
| Admin and Support Services | 495275 | 3096 | 376412.0 | 376.412 |
| Education | 298500 | 596 | 30372.0 | 30.372 |
| Human Health and Social Work | 355805 | 1921 | 106457.0 | 106.457 |
| Arts, Entertainment and Recreation | 280405 | 775 | 80798.0 | 80.798 |
| Other Service Activities | 367490 | 713 | 40928.0 | 40.928 |
Distribution by region
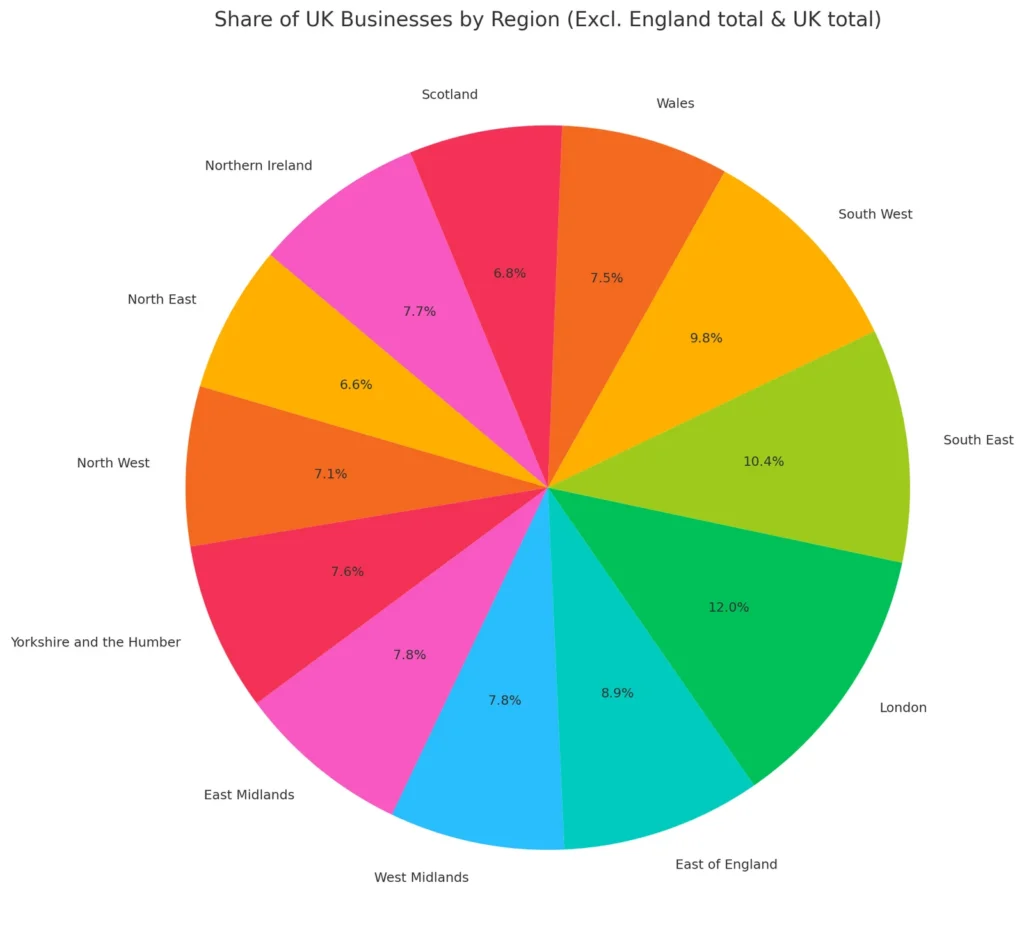
| Region | All Businesses |
| North East | 751000 |
| North West | 811000 |
| Yorkshire and the Humber | 860000 |
| East Midlands | 885000 |
| West Midlands | 889000 |
| East of England | 1016000 |
| London | 1370000 |
| South East | 1188000 |
| South West | 1113000 |
| Wales | 853000 |
| Scotland | 779000 |
| Northern Ireland | 875000 |
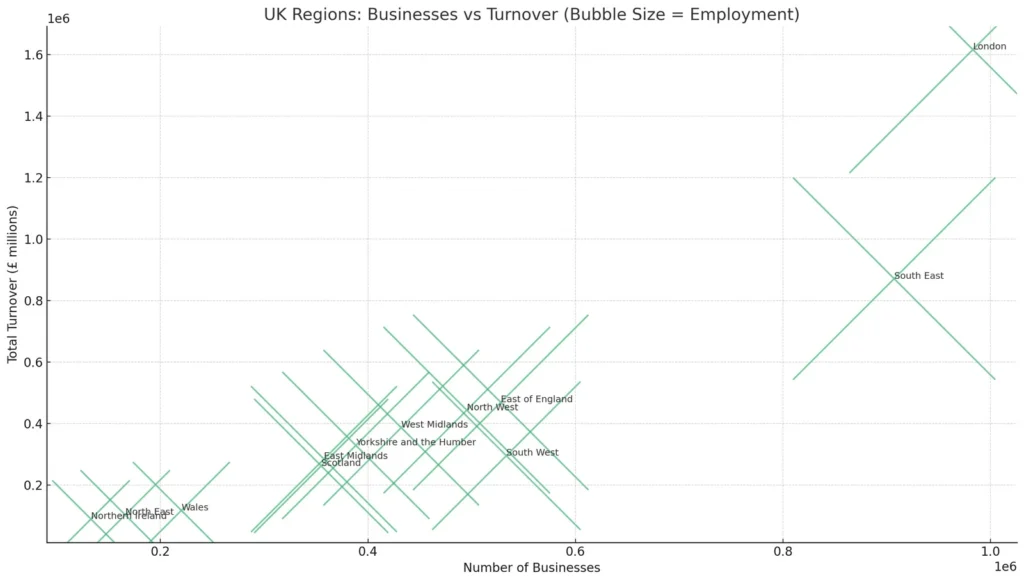
This chart shows
- X-axis: Number of businesses in the region
- Y-axis: Total turnover in £ millions
- Bubble size: Number of people employed in that region
London stands out with the highest number of businesses, highest turnover, and largest workforce.
Historical trends
The UK has experienced fluctuations in its business population over recent years:
- 2020: Peak of 6.0 million businesses.
- 2022: Decline to 5.5 million businesses, a 1.5% decrease from 2021.
- 2023: Small increase to 5.6 million businesses.
- 2024: Decrease back to 5.5 million businesses.
Business Births and Deaths:
In 2023, the UK saw the slowest rate of new business births since 2010:
- New Businesses: 316,000 (11.0% birth rate).
- Business Closures: 309,000 (10.8% death rate).
Sources